Using Crimestat to Best Advantage

What is Crimestat and how does it work – a brief history

On July 26th 2006 Council passed a resolution that directed the Administration to report back to Executive Policy Committee (EPC) and the Standing Committee on Protection and Community Services on the following:

What, if any, additional resources will be required to develop and implement a COMPSTAT style management and accountability mechanism that will provide weekly updates to citizens on crime trends on a geographical basis across each of the Police Districts; and, propose how the existing Police Command structure with its specialized operational units can be augmented by weekly organizational and strategy meetings chaired by the Chief of Police to respond to crime and safety concerns across each geographical districts and coordinate Clean Sweep Task Force Operations; and

How the Administration proposes to measure Police Service outcomes related to crime prevention and enhancement of neighborhood safety.

This direction resulted in the preparation and submission of a report outlining a Neighborhood Safety and Crime Prevention initiative which became known as Crimestat.

The nuts and bolts of the Crimestat initiative are contained in a report from the Police Service to Standing Committee dated January 5th 2007   which can be accessed at:

http://www.winnipeg.ca/clkdmis/ViewDoc.asp?DocId=6830&SectionId=&InitUrl=  (look under Reports at the top of the page and scroll down to #85)

For the casual observer, Crimestat is simply a website that displays crime statistics and crime maps.  For police, it’s significance is far greater.  Crimestat is a management and accountability strategy that directs police commanders to concentrate on emerging crime issues and trends in the area under their command.  It forces them to track criminal activity in their area, identify emerging crime trends, develop effective tactics, and deploy resources quickly to deal with emerging trends in their early stages before they develop into a full blown crime spree.  Lastly, there is follow-up and assessment by the executive.  This is the accountability feature of the process that ensures everyone (commanders in particular) have their eyes ‘focused on the ball’, the ball being crime prevention and crime reduction.

When Crimestat was introduced in Winnipeg in 2007 many were convinced that it could be a useful tool to prevent crime, not in the traditional crime prevention sense in terms of programming, but rather in an operational sense.  What is visible on the public side of the Crimestat site is less detailed than what is available on the police side.  If one studies the numbers (on the police side), specific crime trends can be seen developing in specific areas of the city.  These trends can be nipped in the bud so to speak, largely by identifying and arresting perpetrators.  These preemptive arrests prevent the trend from continuing and reduce the amount of crime.  It’s not the be all and end all but it is a valuable tool.  Like any tool, though, in order for it to work effectively a few basic rules must be followed.

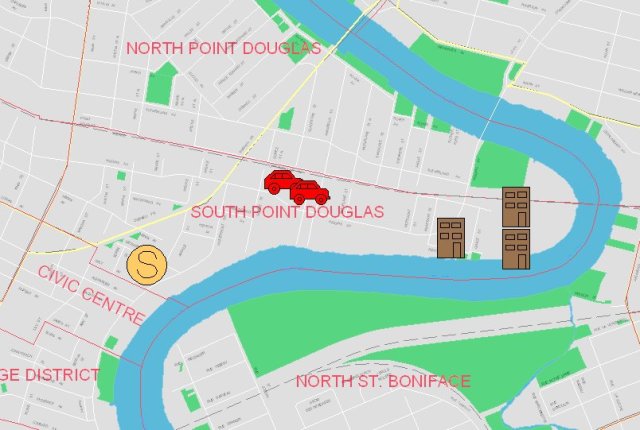
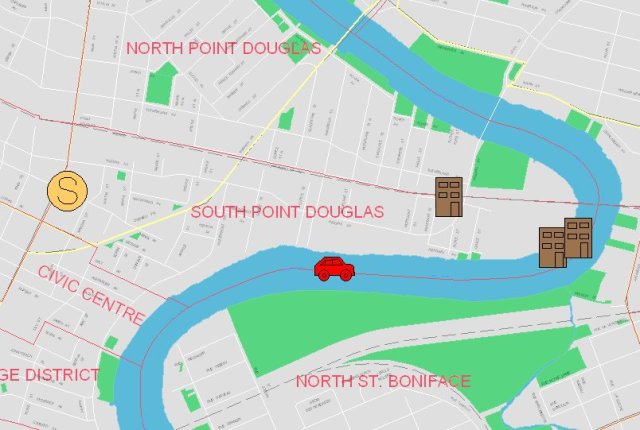
Here is an illustration of how it works:  Using the neighbourhood of South Point Douglas as an example we can go back and have a look at the early stages of what looks to be a pattern of commercial break-ins.

Going back to July of  2009 (on the public site of the Crimestat site you can only go back one year) we see that during the months of July there were 3 break-ins in South Point Douglas.

For the sake of this exercise we will make that the starting point of a ‘trend’.  

July 2009 (3 break-ins)

Source: Winnipeg Police Crimestat website

August 2009  (3 break-ins)

Source:  Winnipeg Police Crimestat website

September 2009   (6 break-ins)

Source:  Winnipeg Police Crimestat website

This trend continued with 0 in October, 3 in November, 1 in December, 3 in January, 0 in February, 4 in March, 2 in April and 5 in May.

At the end of almost a year the crime map for South Point Douglas looks like this:

July 1st 2009 to May 30th 2010

Source:  Winnipeg Police Crimestat website

During that 11 month period there were 30 commercial break-ins in the South Point Douglas neighbourhood.

Police Commanders are provided with this information virtually in real time.  As a trend such as this one develops, commanders assign resources and tactics are developed.  That is, if the series of events is recognized as a trend.  Because there is a high likelihood that these 30 break-ins in close proximity to each other were not committed by 30 different perpetrators but rather by 1 or a group of individuals known to each other, the trend can be halted by identifying and arresting that individual  or group of individuals.

Had that been done back in  July of 2009 when the first break-ins in South Point Douglas occurred the next 30 could perhaps  have been prevented.

That is a simplistic example of how division commanders can use Crimestat to prevent crime.  The principle can be applied to other crimes at the community level.

Crimestat was designed to be a tool to track crime in our city’s neighbourhoods.  It does that very well.  The process has a proven record in helping to combat crime throughout major cities in North America.  In order for it to be  effective the tool must be used in the manner it was designed to be used.  All players in the system must understand and execute their roles.  Division Commanders must stay on top of crime in their area, identify trends and devise effective tactics to deal with them.  The Police Executive must be fully engaged and ensure the resource is used as intended.

The executive of the Winnipeg Police Service does not appear to understand or appreciate the capabilities of Crimestat and that could explain why they have largely turned their backs on it.  A key aspect of the Crimestat process centers on  accountability.  The Executive needs to hold Division Commanders accountable. Accountability is exercised most visibly during Crimestat meetings.  That cannot happen if the Executive does not attend Crimestat meetings.   Residents of Winnipeg have a vested interest in the overall safety of all neighbourhoods.

Winnipeggers need Crimestat to work.
Where Crime is Taking Place

All it takes is a glance at the Winnipeg Police Crimestat website to see that there is no real surprise here in terms of the recent shootings in the City’s West End.  And certainly no need on the part of the police to be shocked as they recently claimed.

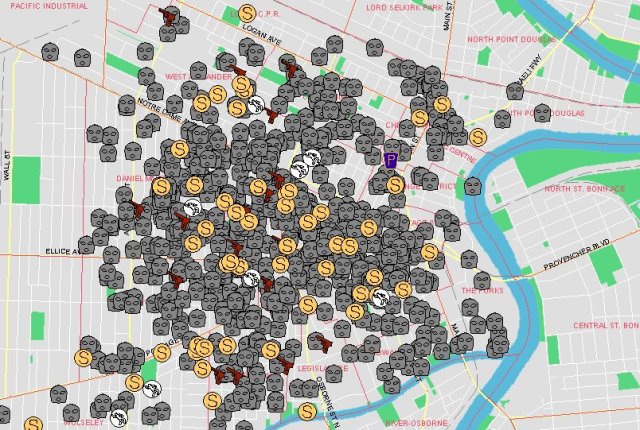
When it comes to homicides, shootings, sexual assaults and muggings (the four main crime types being tracked by Crimestat that are classified as  “crimes against persons”), Crimestat tells the public exactly what most police officers working in Divisions 11 and 13 are already aware of.  These four specific types of crime occur with alarming frequency in Districts 1 and 3 and more specifically in rather small geographical areas within those two Districts.  As seen below, the first Crimestat map makes that point:

City wide map showing homicides, shootings, sexual assaults and muggings from June 16th 2009 to June 14th 2010.

Source:  Winnipeg Police Crimestat website

The above map shows two very distinct data clusters, one in District 3 and an even larger one in District 1.  The two maps below show a close up of those two areas and leave no doubt as to the high number of homicides, muggings, shootings and sexual assaults.

Crimestat map showing homicides, shootings, sexual assaults and muggings in a portion of District 1 for the period June 16th 2009 and June 14th 2010.

Source:  Winnipeg Police Crimestat website

Crimestat map for a portion of District 3 depicting the same four offences for the same period:

Source:  Winnipeg Police Service Crimestat website

These two Districts, and primarily the concentrated areas of the two districts shown above,  account for  70% of all homicides,  68% of  muggings, 55% of sexual assaults and 88% of all shootings in the entire city for the period between June 16th 2009 and June 14th 2010.

Still shocked about what happened recently in the West End?

The police response has been predictable.  More officers, more guns, more arrests, more seizures.  In other words, more visible evidence of police activity.   In the next little while we will be seeing reports and statistics outlining those numbers as a testament to the efficiency and effectiveness of the approach being taken by police.

Ask yourself, is it really effective in a long term sense?  Can you arrest your way out of a social problem?

Sir Robert Peel suggested a measurement to test police efficiency that concentrated not on statistics listing police activities but rather a measurement of the level of crime (or lack thereof) in the community.  Peel’s Ninth principle says:

To recognize always that the test of police efficiency is the absence of crime and disorder, and not the visible evidence of police action in dealing with them.

Let’s make sure we don’t get too dazzled by the activity.  Let’s look down the road and measure what is being done in the West End based on outcomes.  In  this case, the absence of crime.

Police to Staff Ratios

According to Marc Pellerin, Vice President of the Winnipeg Police Association, in an article in the June 6th edition of the Winnipeg Sun, the  City’s answer to increased workloads in the Winnipeg Police Service is  “whipping the same tired ponies” to do more.    The Association advocates for more “ponies” and they may well be in a position to make that case.  The question is,  should they be police “ponies” or staff “ponies”.

Pellerin makes the observation that the City has funds available to pay overtime for  revenue generating activities that relate to traffic enforcement but lacks the funds for other activities such as investigations of serious violent crime.  The latter, although a major threat to the safety of Winnipeg’s citizens, does not generate cash flow for the city’s coffers as traffic enforcement does and instead represents a monetary drain.

In the overall context of staffing and workload there may be another more basic and fundamental issue at play here.  Cities, when setting police budgets, frequently use comparisons to other cities to justify either increased or decreased police related spending.  The most frequently used comparisons center around police to population and per capita cost of policing ratios.  Table 1 displays that information for Winnipeg and three other Canadian cities.

Table 1

City Police to Population Ratio Per Capita Cost
Winnipeg 1:491 $256.00
Toronto 1:471 $348.00
Edmonton 1:628 $305.00
Calgary 1:631 $265.00

Source:  Statistics Canada (2008)

There is one other ratio that has a very direct impact on police efficiency and effectiveness – the staff to police ratio.  Unfortunately, it does not garner the same attention as the number of police officers on the street.  It should, though, as the staff to police ratio is one of the determining factors as to what portion of their 10 hour shift officers spend on the street and what portion they spend in the office.   Table 2 shows that information for the same four cities:

Table 2

City Police Officers Support Staff Staff/Police Ratio
Winnipeg 1358 369 1:3.69
Toronto 5633 2895 1:1.94
Edmonton 1457 520 1:2.80
Calgary 1723 629 1:2.73

Source:  Statistics Canada (2008)

Part of the workload problem identified by Pellerin may not relate so much to the actual number of police officers as to the staff to police ratio.

Sometimes an analogy helps to clarify an issue.  Let’s use a restaurant as an example. For the sake of argument let’s assume that restaurants have only two classifications of employees, servers who take and relay orders and serve the food once its prepared, and cooks who receive the orders and prepare them.  The number of serving personnel and cooks required are determined by the demand ( in a police setting that would be the amount of crime and the number of calls for service).

Once the demand is determined the restaurant owner hires servers and cooks based on demand.

If there are too many servers and not enough cooks, the orders will be taken quickly but there will be a delay in the food being served as there is a backlog in the kitchen.  If there are too many cooks and not enough serving staff, there will also be delays – but for a different reason.  There will be delays in taking orders.  The orders, once they get to the cooks, will be prepared quickly but will sit and get cold waiting for a server to deliver them to the customer.

This is where the role of management becomes important.  Management must recognize the problem and balance the ratio of cooks and servers to achieve an efficient use of human resources.

What happens when management does not address this issue?  The cooks and the servers will step outside their assigned job functions to make the situation work despite management inaction.  The ‘system’ will attempt to self regulate itself and reach an equilibrium.

If you have too many servers and not enough cooks, the cooks will engage some of the servers to cook.  It the opposite is the case, some of the cooks will start serving the food.

So if the system will tend to self regulate itself, what is the problem?  It’s this: servers may not have the qualifications to be cooks and the quality of the food being prepared will suffer and invariably result in customer complaints.  Cooks may well be able to satisfactorily serve food but it is a poor use of resources as they are being paid at a higher rate than servers and to use them as servers in the long-term is not economically feasible.

In restaurants as in policing, the proper ratio is important.  Just as in restaurants if the police to staff ratio is not appropriate, either of two things will start to happen.   If you have too many staff members and not enough police officers the staff members will attempt to undertake ‘police work’ for which they are not trained.  On the other hand, if the ratio is skewed the other way and you don’t have enough staff, sworn police officers will through necessity start performing staff work just to get the job done.  This means fully armed and highly paid police officers will be in the police station performing administrative tasks instead of out on the street dealing with crime.  This is what is happening in Winnipeg.

Until the police/staff ratio is recognized as an issue and addressed,  police officers will spend too much of their time doing administrative tasks such as filling in forms, writing reports, and  filing.  In other words, administrative functions.

In Winnipeg the staff/police ratio is 1:3.69.  There is a reason why other police agencies strive for a ratio in the range of 1:2.5.  It relates to efficiency; it relates to effectiveness;  its part of sound human resource management; and effective use of resources.

The Mayor likes to add to the police complement (providing the Province is willing to fund the positions, of course) but it seems there is a hesitancy to bolster the number of support staff.  Eventually the imbalance in the police to staff ratio will jump up and bite you.  Actually, it already has.

Can a Police Helicopter Make Police Pursuits Safer

The short answer is yes, if it gets there on time.

In a recent article the expert on all things related to helicopters and photo radar AKA Winnipeg Sun columnist Tom Brodbeck again painted a picture for us on how peacefully vehicle pursuits in Winnipeg will end once the police Service has its helicopter.

It seems that every time there is a vehicular pursuit in Winnipeg that does not end well someone in the media makes sweeping statement about how this could have been avoided had the Police Service had its helicopter.  Police vehicle pursuits often end in collisions some with tragic consequences.  There is no doubt that with the presence of a helicopter some tragedies might have been avoided but a caveat needs to be attached.  The caveat is:

  • Had the helicopter been airborne at the time of the incident.

With an optimistic projection of 1000 flight hours per year the Winnipeg police helicopter will be airborne an average of 2.73 hours per day, that just under 12% of the time.  It becomes obvious that unless the police can convince auto thieves to only lead police on car chases during the hours the helicopter is in the air, the vast majority of chases will still need to be addressed using conventional methods.

An examination of vehicle pursuit data in Antonio Texas obtained by the San Antonio Express-News under the Texas Public Information Act revealed some interesting facts:

  • The San Antonio Police Department makes every effort to deploy a helicopter to all police pursuits.
  • Half of all chases end in 3 minutes or less.
  • In San Antonio the helicopter is able to assist in about one-third of all police chases.
  • Two thirds of the time the helicopter was either not in the air or tied up on other calls.

By the way, San Antonio has a fleet of four helicopters.

My original estimate that police in Winnipeg might be able to achieve a 12 per cent attendance rate may have been overstated.

The question that needs to be asked is not only how pursuits are ended but rather why they are initiated.  In a recent study titled Police Pursuits in the Age of Innovation and Reform (2008) available at http://www.theiacp.org/LinkClick.aspx?fileticket=IlJDjYrusBc%3D&tabid=392 the authors Cynthia Lum and George Fachner concluded that once the decision is made to initiate a pursuit in 72 per cent of the cases the outcome (in terms of how the pursuit ends) is almost entirely out of the hands of police.

This underscores the importance of having a sound pursuit policy that places realistic restrictions on the circumstances under which police will pursue a vehicle.  Secondly it underscores the importance of ensuring the pursuit policy is complied with.

Because police pursuits can result in tragic consequences they should not be undertaken lightly.

Maintaining the Public Respect

Some Short Term Pain for Long Term Gain

A recent column by Kevin Engstrom in the Winnipeg Sun caused me to reflect on an earlier post  dealing with the issue of police retaining the respect of the public.  It fits in well with Sir Robert Peel’s second principle which says:

To recognize always that the power of the police to fulfill their functions and duties is dependent on public approval of their existence, actions and behaviour, and on their ability to secure and maintain public respect.

Retaining the respect of the public is best achieved through openness, transparency and accountability.  If the police set and apply a different standard for dealing with members of the Service than would apply to a member of the public, the Service is well on its way to sliding down the slippery slope  of ethical decay and abandonment of their sacred public trust.

Some police agencies actually have a specific section in their media policy that deals with the release of information as it relates to police members who are charged criminally.  In most instances these policies require immediate release of information such as the officer’s name, rank, years of service, the charge as well as the officer’s current status with the Service.    That removes the temptation  to withhold information or any  attempt to ‘time’ the release so as to mitigate what the organization might see as negative media coverage.  In the long run the public support and respect garnered through openness and transparency  far outweigh any potential negative consequences.  The public is generally willing to accept that there will be limited instances of criminal activity by police officers.  They do, however, want to be assured that such behavior will not be tolerated and will be dealt with quickly, openly and fairly.  In other words:  that the police service is prepared to clean its own house.

Based on  Mr. Engstrom’s example, the Winnipeg Police Service would not appear to  have the appropriate media release policy in place, that is, one that requires immediate release of  pertinent information when an officer is charged.  Conversely, if they do have such a policy but are choosing to ignore it, then their behavior is  beyond merely ‘ethically sketchy’.

Either way, it’s a problem.

The below link is to Mr. Engstrom’s column.

http://www.winnipegsun.com/news/columnists/kevin_engstrom/2010/05/29/14188396.html