CPTED Part II

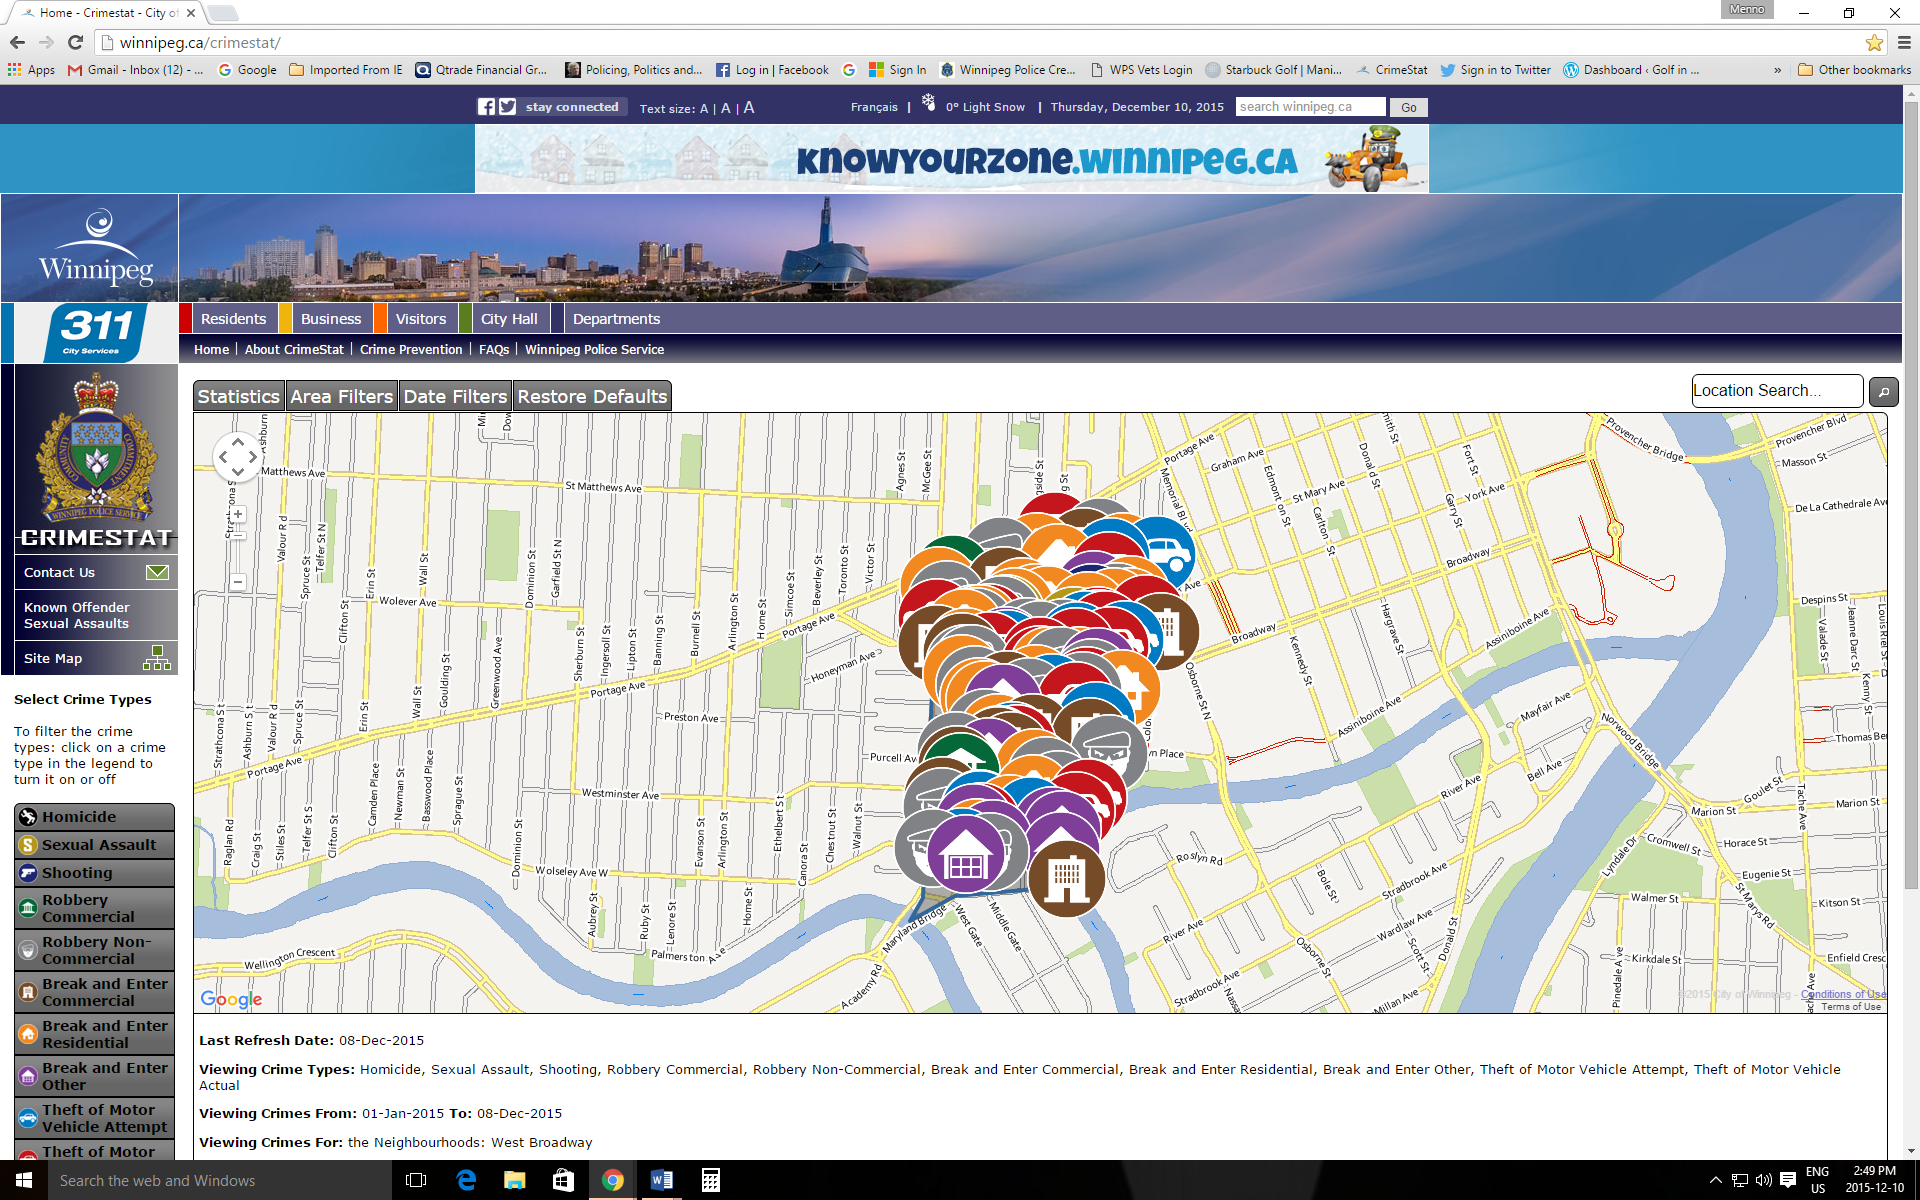
In my previous post on CPTED I displayed a number of screen shots of communities in the City of Winnipeg that showed very low crime rates.  The communities in question benefited from the application of some basic tenets of CPTED, namely, a natural barrier (the river) surrounding the communities as well as limited points of entry and exit.

Those naturally occurring features might prompt the question: what do you do if there is no river or other natural  barrier?

The fact is, that if addressed during the development and building stages of a community, man-made features can be added to replicate features that naturally occur in other communities.  Not only can the features be replicated, so can the results in terms of a reduction in crime.

The pictures below are of a residential areas within the boundaries of the Brockville community in the south-west area of Winnipeg.  As can be seen in the pictures the community has very limited points of entry and exit (two), and a boundary (a fence) surrounding it.

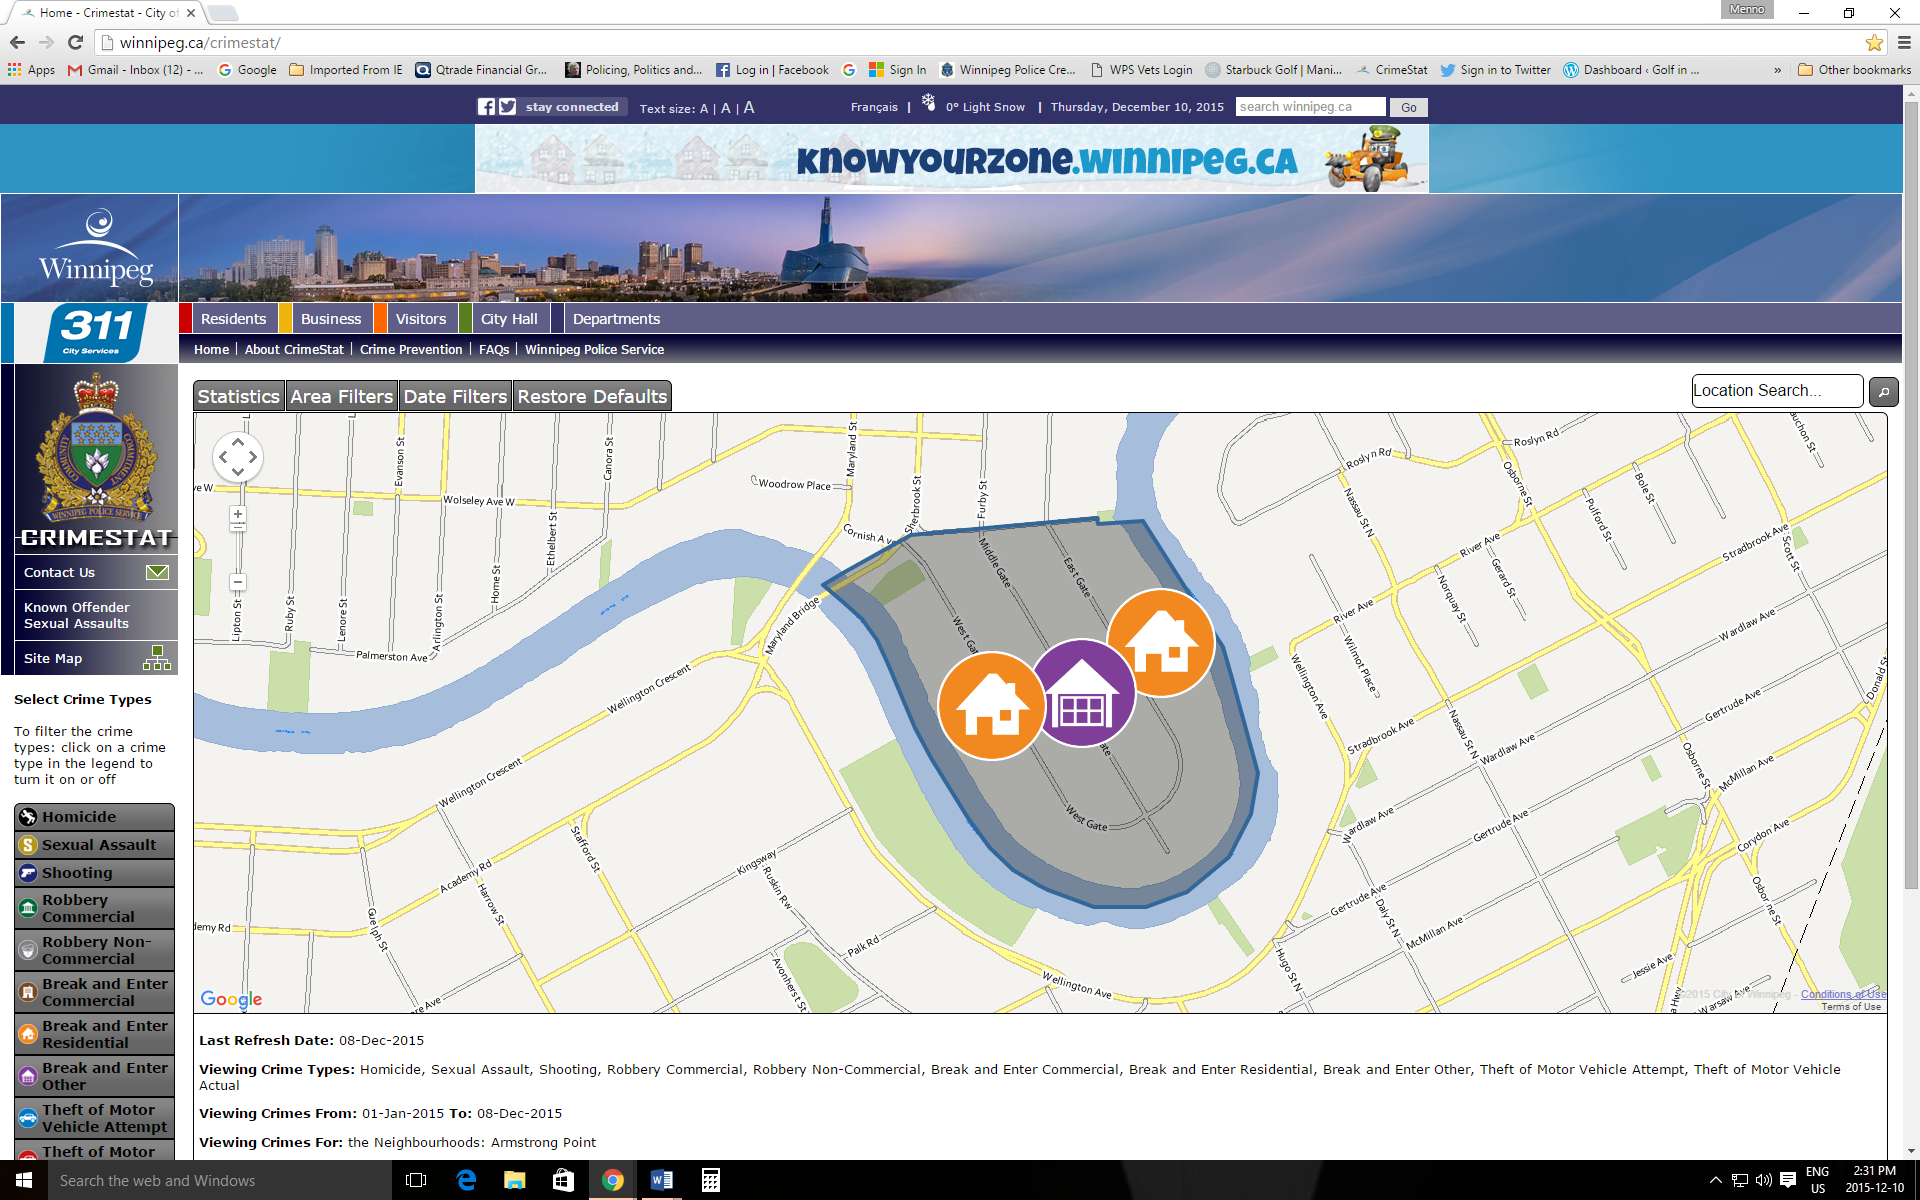
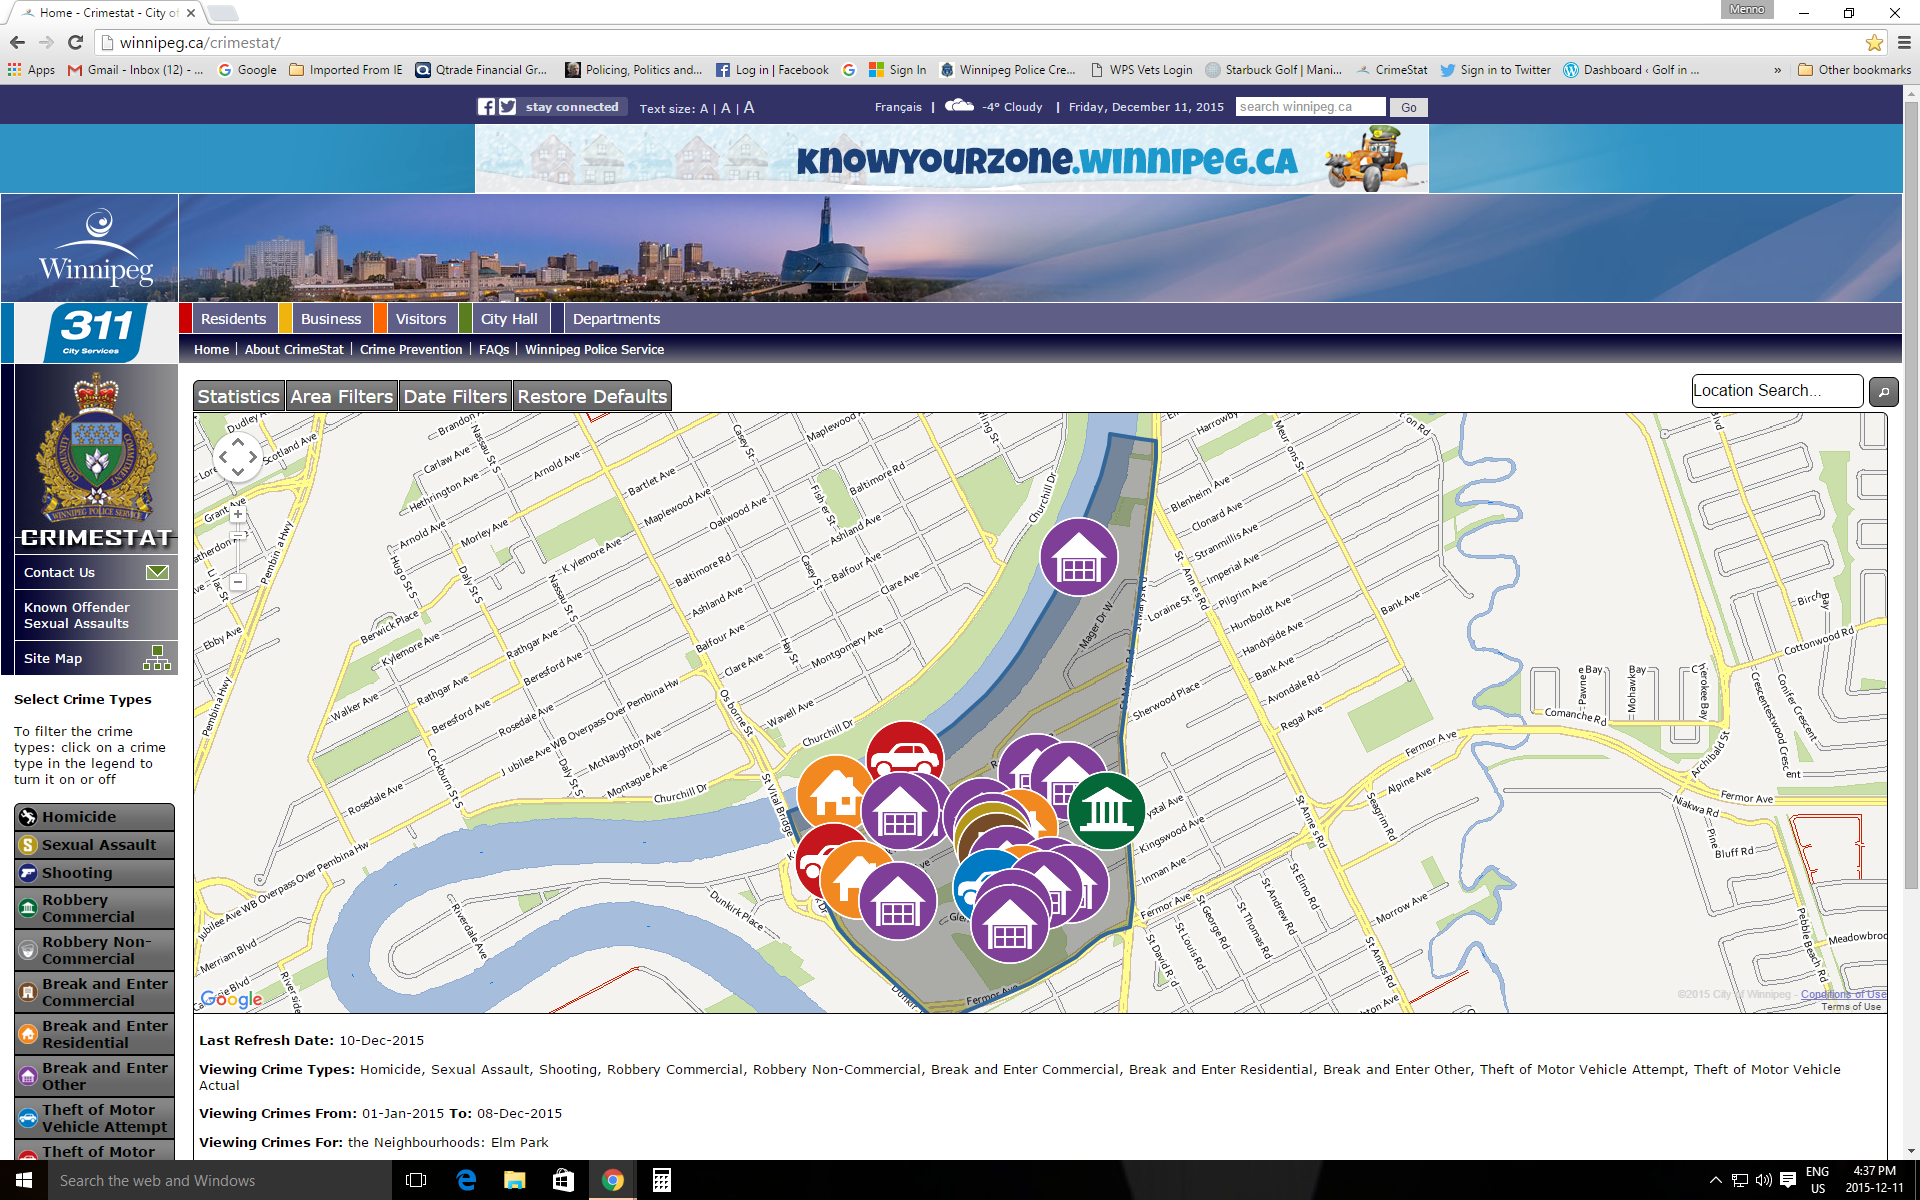
Brockville is another community, or portion of a community, that shows a very low crime rate.  As a matter of fact, according to Crimestat, of the criminal offences tracked by Crimestat this community had no reported crime between January 1 2015 and December 15 2015.


OLYMPUS DIGITAL CAMERA

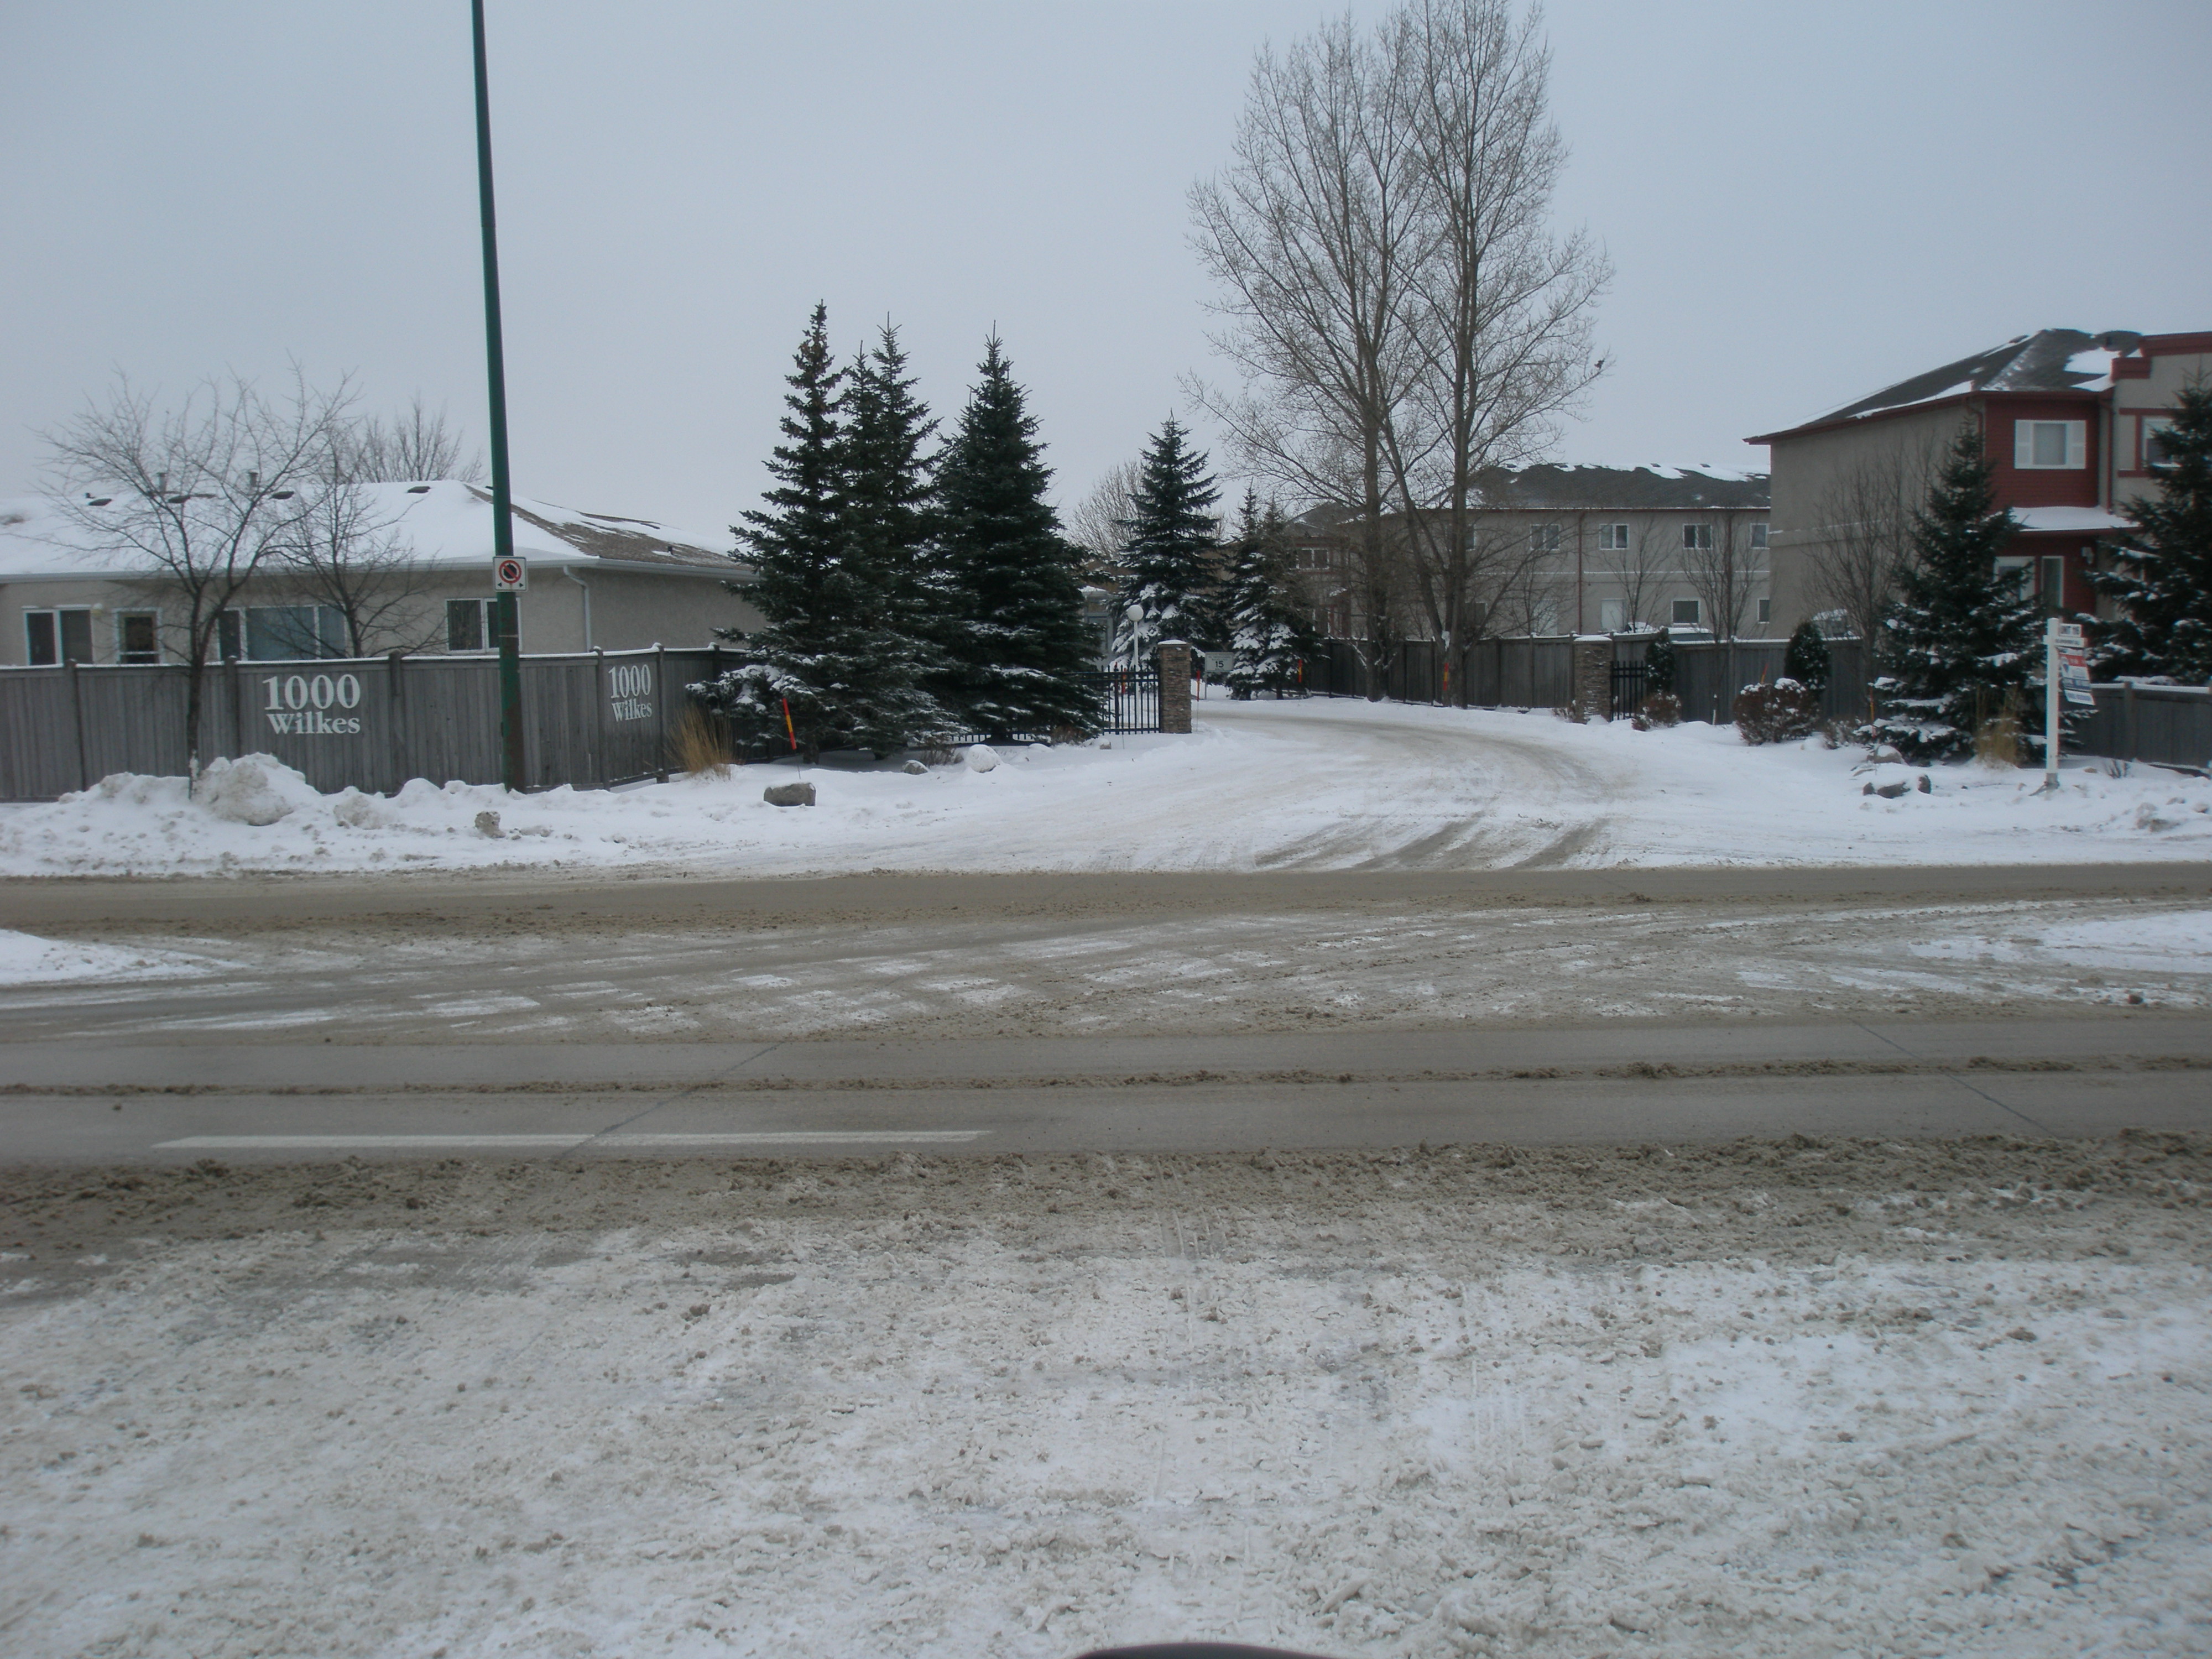
View of the one entry/exit to the east portion of the development


OLYMPUS DIGITAL CAMERA

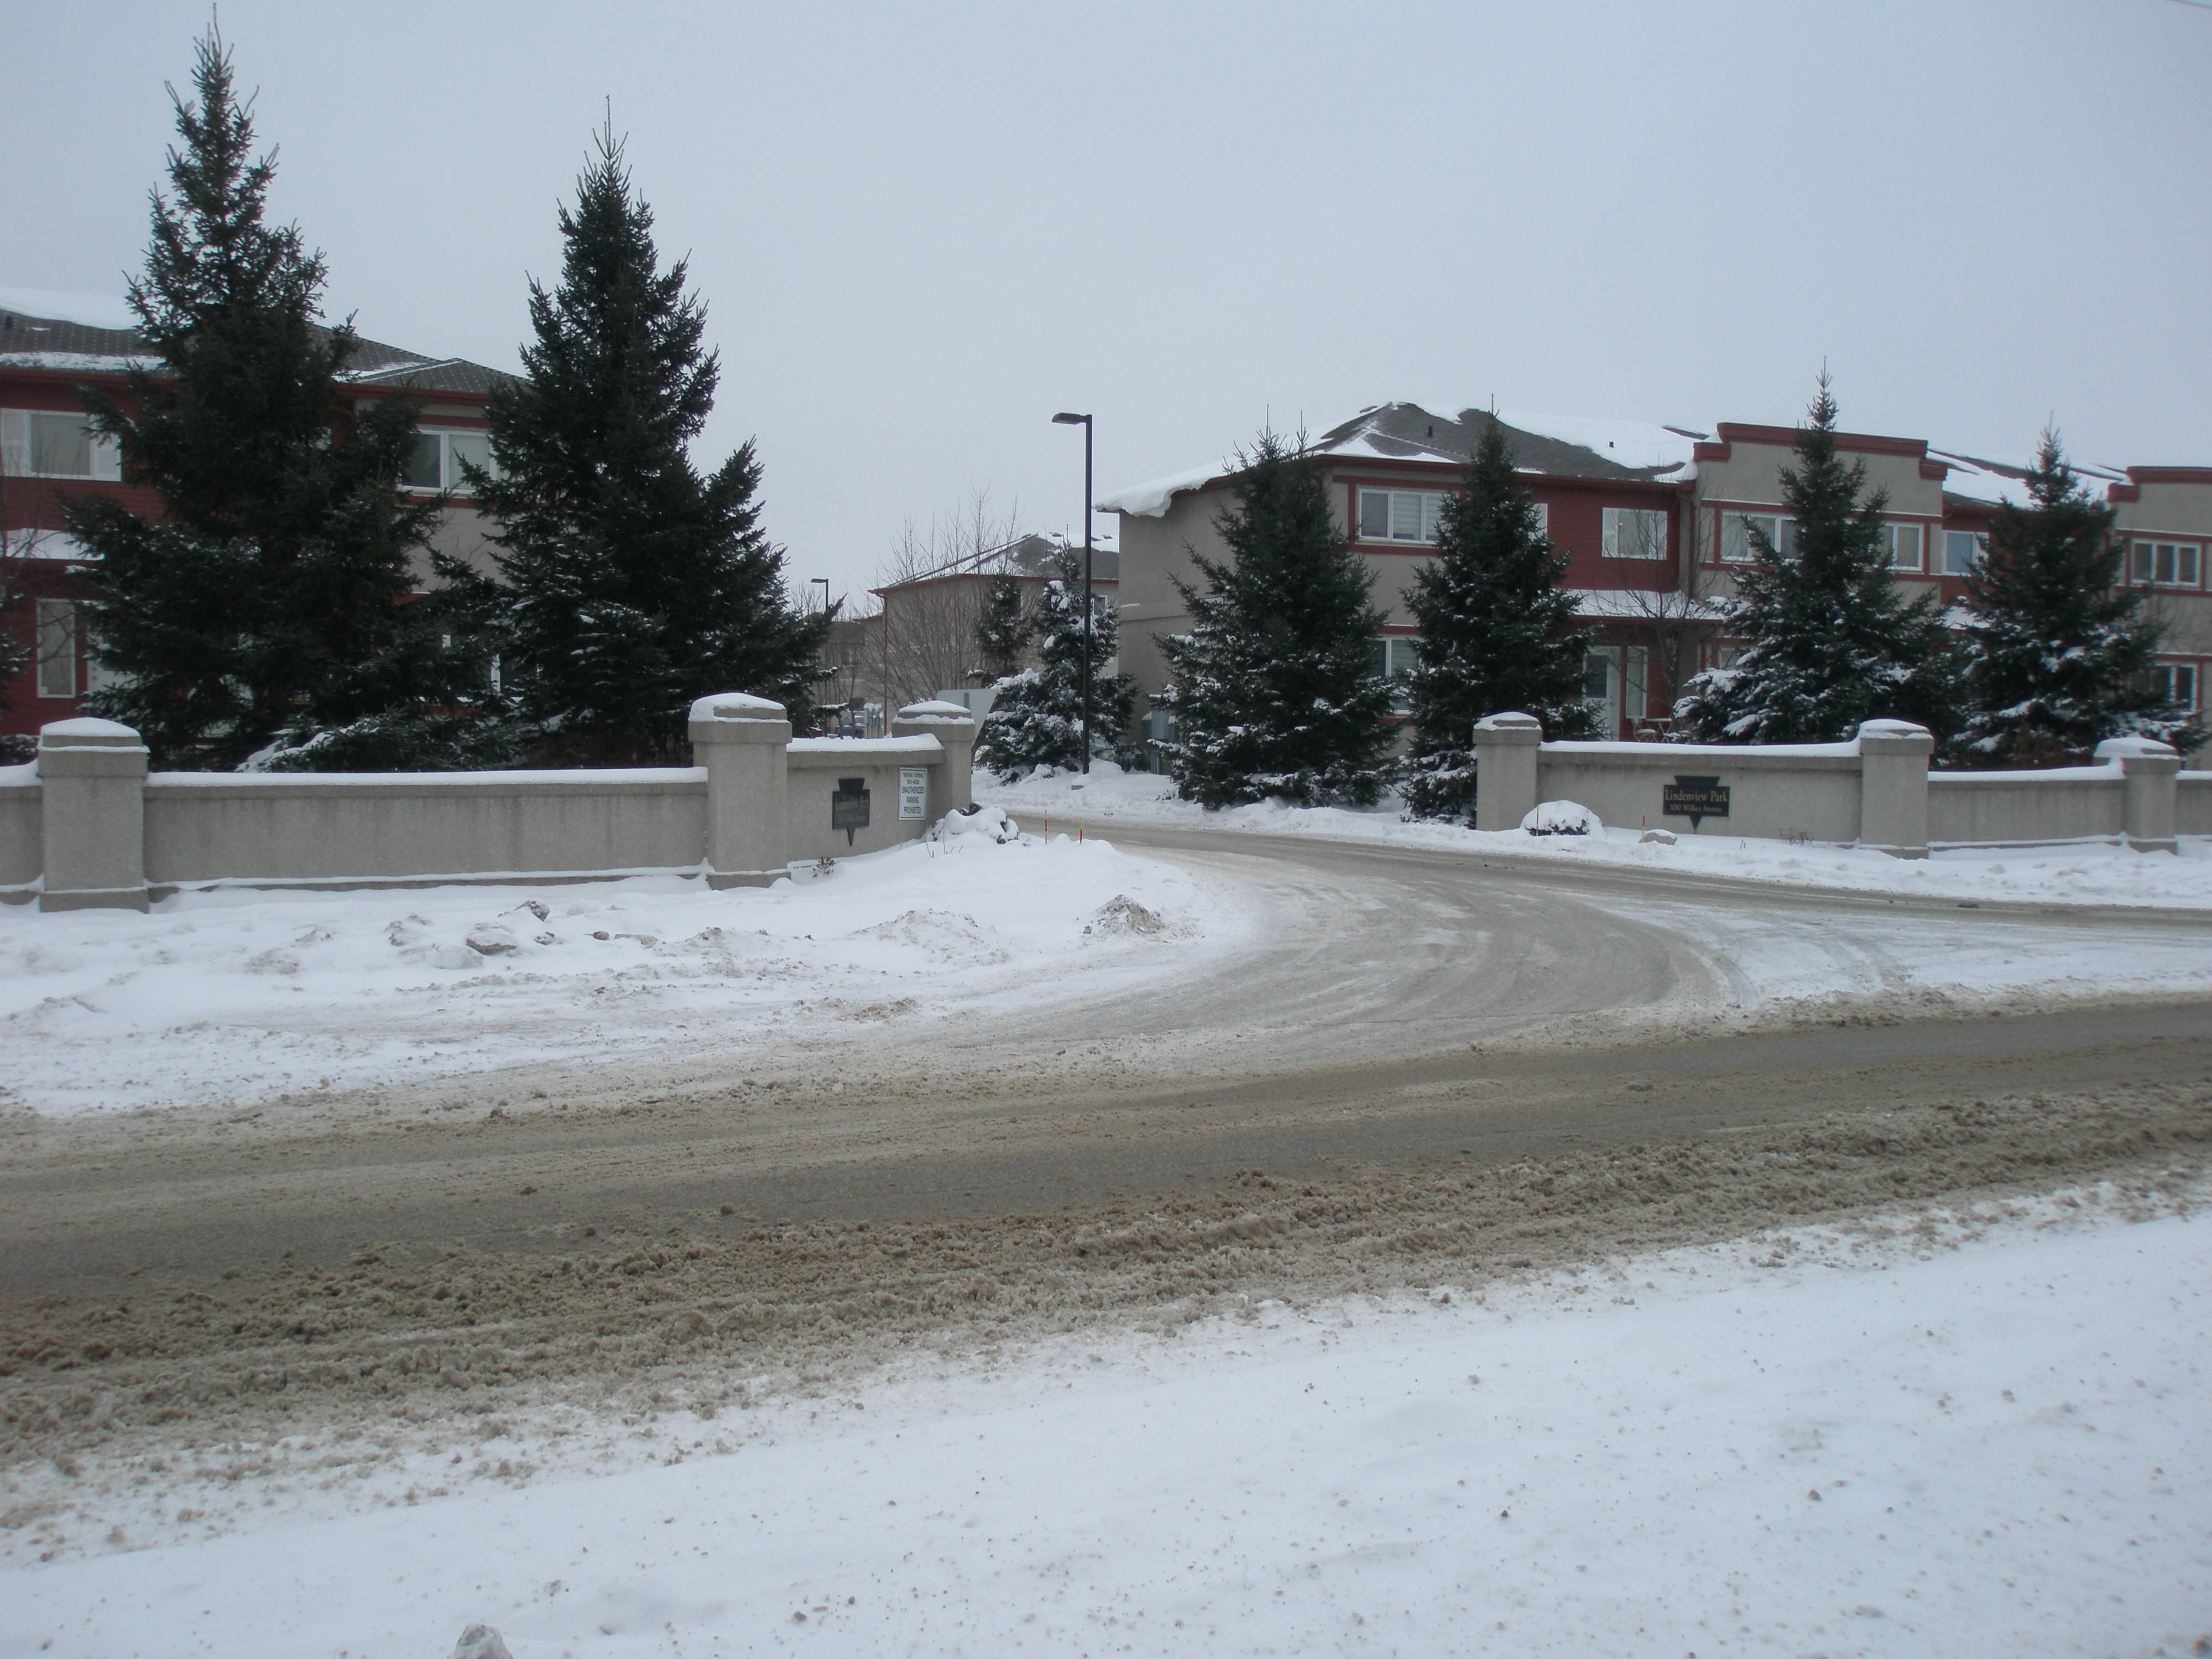
View of the one entry/exit to the west portion of the development


OLYMPUS DIGITAL CAMERA

Border fence along the south edge of the development, facing Sterling Lyon Parkway


OLYMPUS DIGITAL CAMERA

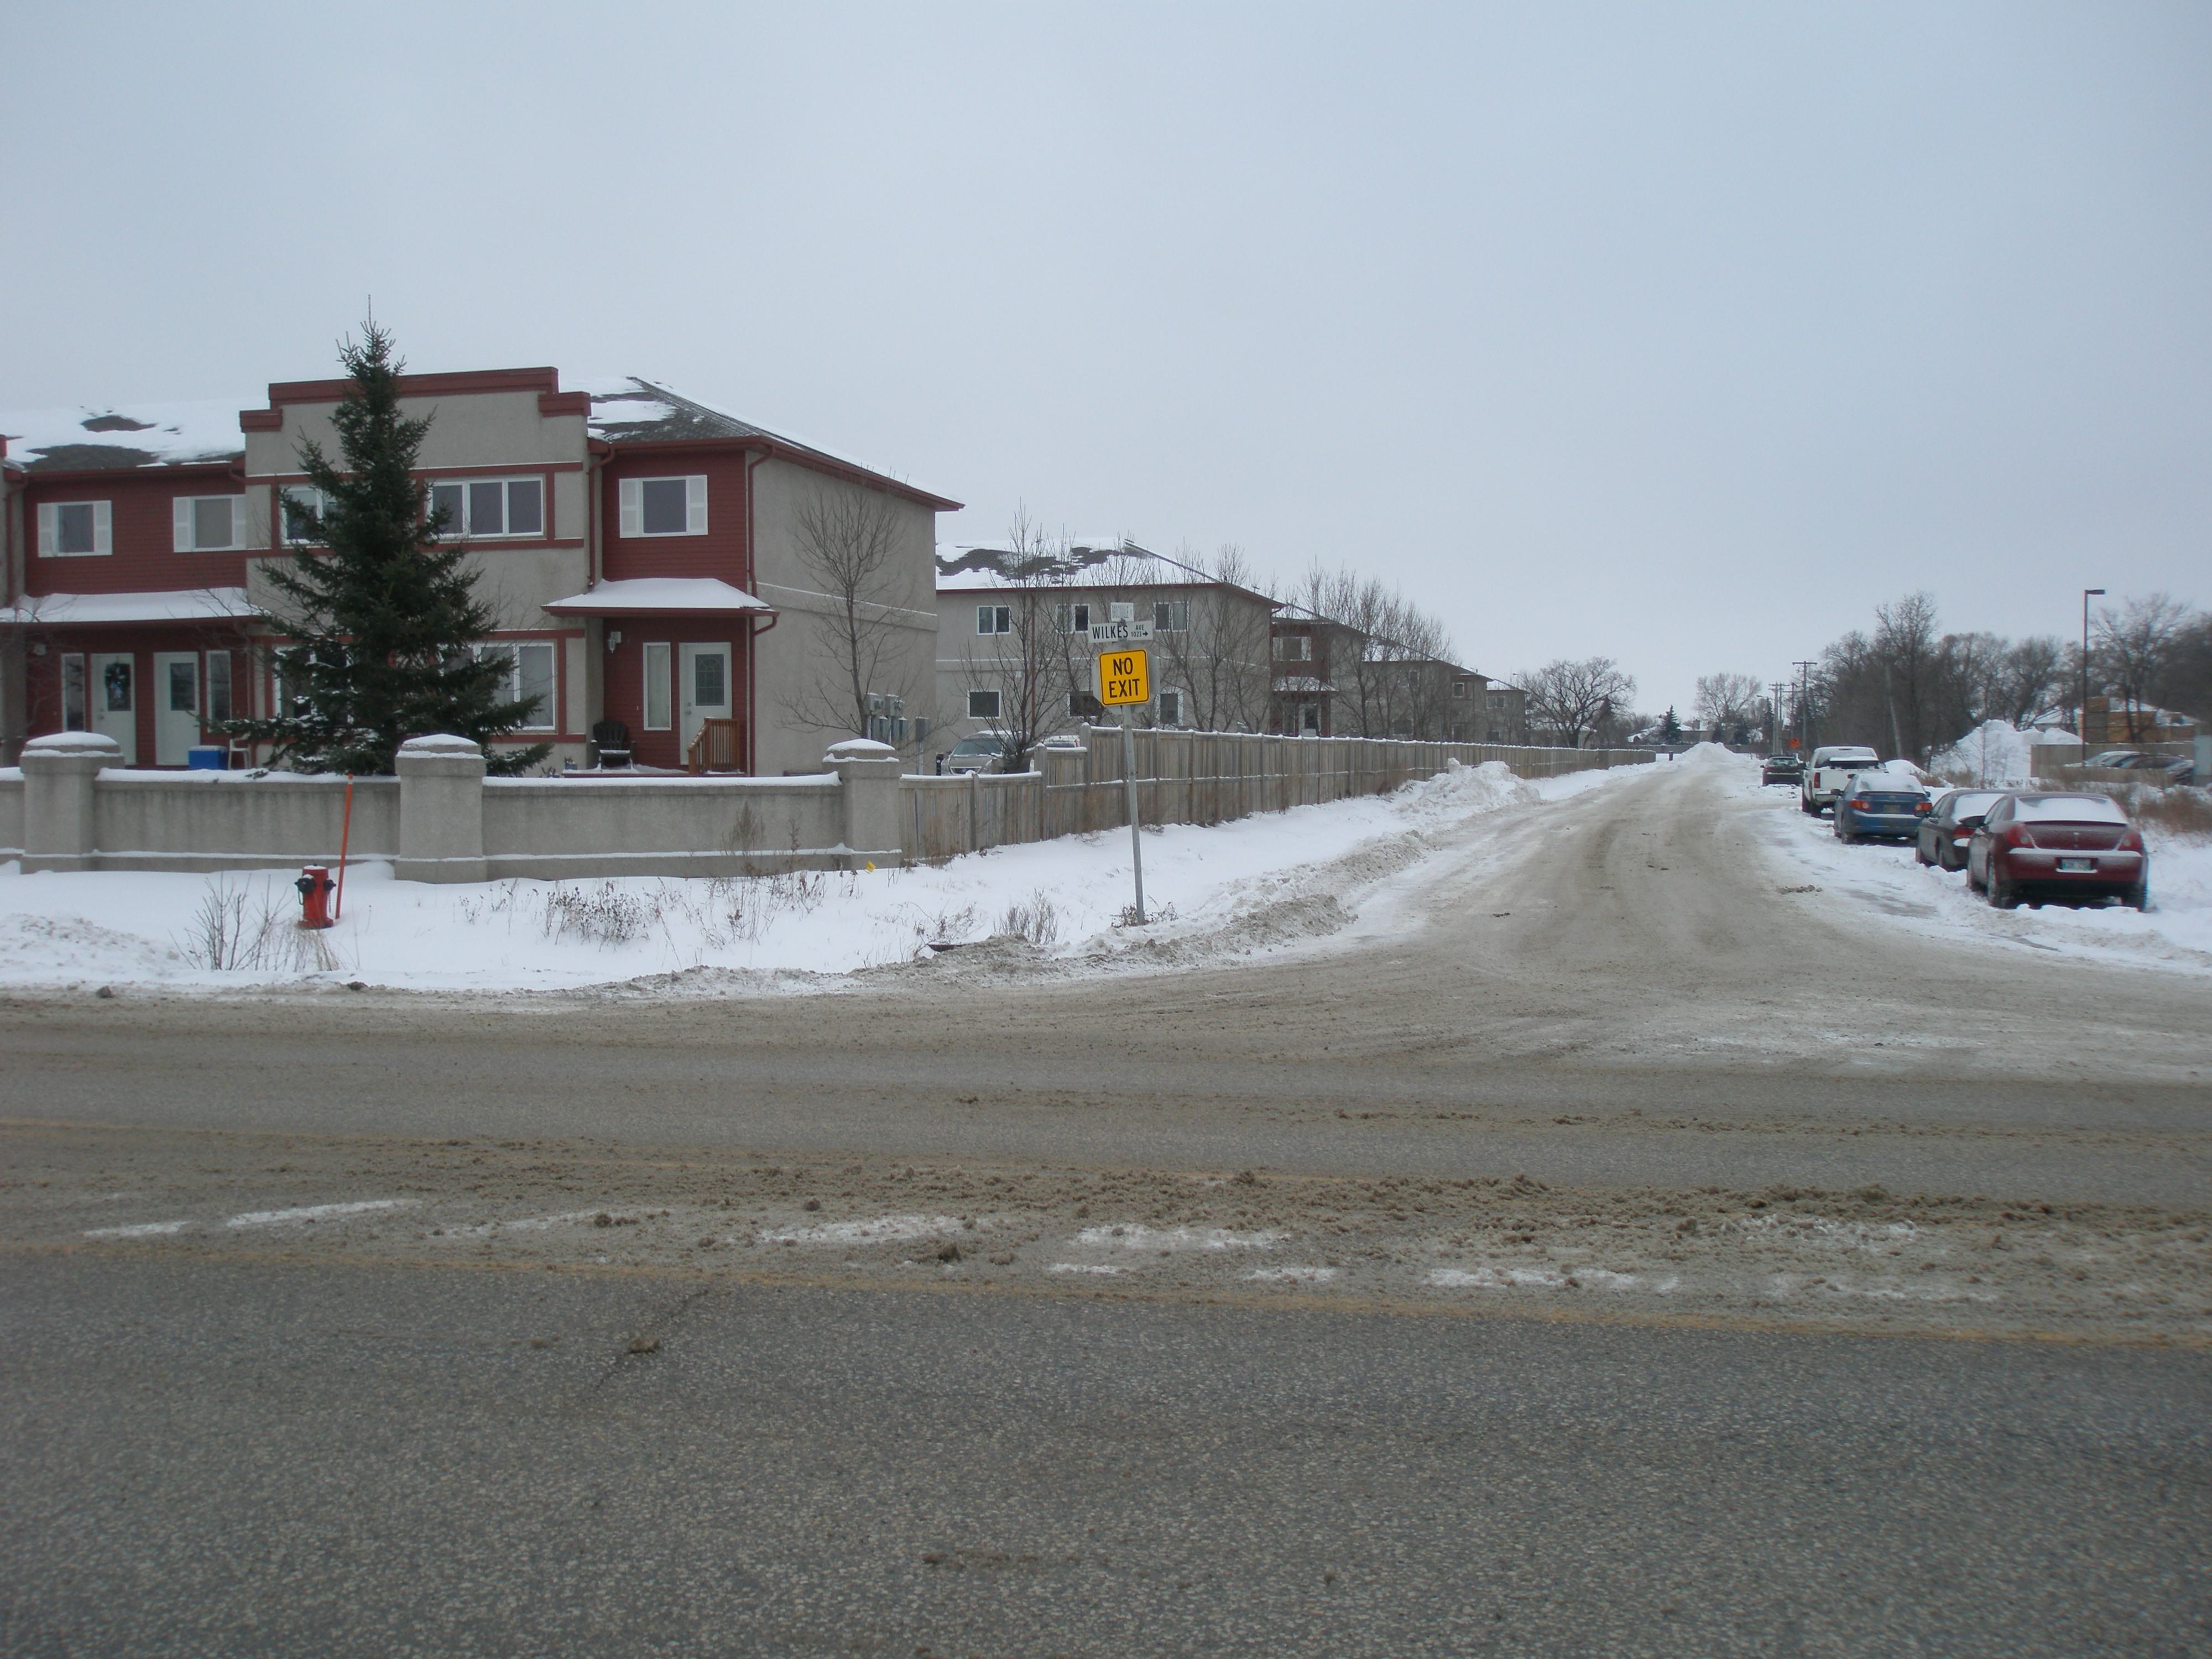
Border fence along the west edge of the development running parallel to Brockville Street


The gray area  in the screen shot (below) is a representation of the entire Brockville community.  The pie shaped area outlined in black is the Brockville residential development.  The development itself consists of single storey bungalow style townhouses in the east portion, and multi-story apartment style town houses on the west side.

Although not a high-end gated community, the incorporation of just two aspects of the CPTED design philosophy (limited points of entry and a boundary) can have a dramatic effect on crime rates.


Source - Winnipeg Police Crimestat on 2015-12-15

Source – Winnipeg Police Crimestat, Screenshot taken on  2015-12-15

Winnipeg Crime Statistics (2015) by Electoral Ward

The statistics presented in this post are for the 8 crime types tracked by Winnipeg Police Crimestat for the dates  January 1st. 2015 and December 31 2015.


The numbers in parenthesis are the number of crimes reported to police  (2015/2014)


Old Kildonan  -7%   (384/414)

Point Douglas  -5%  (1009/1059)

St. Charles  -3%    (199/205)

Mynarski   0%   (1056/1061)

Transcona  +2%   (305/298)

St. Boniface  +11%  490/440)

Fort Rouge/East Fort Garry  +8%  (661/611)

Charleswood/Tuxedo  +12%  (217/194)

St. Vital  +20%  (437/364)

St. James/Brooklands/Weston    +21%  (663/548)

Elmwood/East Kildonan  +22%  (610/500)

River Heights/Fort Garry  +23%  (513/418)

Daniel McIntyre  +23%   (1060/862)

North Kildonan  +24%   (299/242)

South Winnipeg/St. Norbert  +31%  (403/307)


Observations

Except for the St. Charles ward, which has very little crime to begin with, the three wards that saw decreases or remained the same are all in the north end of the city (District 3).

The Daniel McIntyre ward edged out Mynarski as the ward with the most reported crimes.

The south-west, and south-east portions of the city showed major increases in property related crime.

Crime in Winnipeg up 11%* in 2015


The numbers in this post are  based on the 10 crime types tracked by the City of Winnipeg Crimestat program between January 1 2015 and December 31 2015.  

* The original version of the post represented crime numbers  up until December 28th 2015.  


City Wide Highlights

The Good

Murders are down by 19%,  with 22 compared to 27 in 2014.

Attempted theft of motor vehicle is down 10%.

Sexual assaults are down 4%.

The Bad

Theft of motor vehicle is up 3%.

Non-commercial robberies (muggings) are up 3%.

Shootings are up 9%

Break and enter other (stand alone  buildings) are up 10%

The Ugly

Residential break ins are up 19%.

Commercial break ins are up 22%.

Commercial robberies are up 36%.


District 1

District 1 saw an overall increase of 15%*.  The  increase can be largely attributed to break ins other (57%), residential break ins (29%),  attempt theft of motor vehicle (17%) and theft of motor vehicle (12%).   Most other categories were static. On a positive note murders dropped by 50% to 7 from 14 in 2014.

District 2

District 2 saw an overall increase of 20%*, led by commercial break ins (51%), commercial robberies (21%), break and enter other (18%), residential break ins (15%), and theft of motor vehicle (17%).

District 3

District 3 was the only district that saw a drop in crime, down 5%*.  Attempt theft of motor vehicle was down (22%), theft of motor vehicle down (19%), break and enter other down (16%), commercial break ins down (14%).  Commercial robberies were up (44%), as were sexual assaults (29%), and residential break ins (14%).

District 4

The increase in District 4 was 16%*.  The biggest factors contributing to the increase were commercial robberies (83%), commercial break ins (50%), residential break ins (20%) and non commercial robberies (10%).

Downtown

The area defined as the ‘Downtown’ saw an increase of 6%.  The offences that pushed the numbers up in the downtown area were primarily break and enter other (143%), and residential break ins (32%).

Observations

  1. Residential break ins were up in all four Districts ranging from 14 to 29%, with a city-wide average increase  of 19%.
  2. The number of stolen vehicles went up in all districts except District 3 which saw a reduction of 19%.
  3. Break and enter other increased in all districts except District 3 which saw a reduction of 16%.
  4. Commercial break ins  went up 22% city-wide but were reduced by 14% in District 3.

Questions

  1.  What, in policing terms, was done differently in District 3 compared to the other three Districts in 2015?
  2.  Were a significant number of personnel assigned to the other three Districts shifted to  District 3?
  3. What steps will the Winnipeg Police Service be taking to address the significant increase in the number of break ins and robberies?

A future post will provide a further breakdown of crime by Electoral Wards, as well as a look at  some specific neighbourhoods.

*Update

The statistics in the original post which covered the period from January 1, 2015 to December 28 2015 have been amended to correspond to what currently appears on the Crimestat site which included the last 3 days of 2015.

The changes made are as follows:

City wide rate changed from +9% to +11%

District 1   from +12% to +15%

District 2 from +18% to +20%

District 3 from -6% to -5%

District 4 from +15% to +16%


Crime Prevention Through Environmental Design

What is  Crime Prevention Through Environmental Design (CPTED)

In a nutshell Crime prevention through environmental design is a multi-disciplinary approach to deterring criminal behavior through environmental design.  CPTED strategies rely upon the ability to influence offender decisions that precede criminal acts.  As opposed to target hardening which makes it more difficult to commit crimes such as break-ins, CPTED attempts to deter criminals from even picking a target in a particular area.  It is premised on the theory that criminals make rational choices and that if the cost (chance of getting caught) are great enough criminals will not commit the crime.

CPTED is a multi-faceted approach but two of the tactics it employs in relation to neighborhoods are:

  1. minimize the number of entry and exit points on a block; and
  2. design roadways to discourage through-traffic.

Couple those two tactics with a barrier around a neighborhood and you have an excellent recipe for crime prevention.

It is theories, based on CPTED principles,  that led developers to come up with the gated community concept.

What follows are  three examples of naturally occurring crime prevention measures, namely a river surrounding  a community with a limited number of entrances and exits and roadways that discourage and in some cases eliminate through traffic that clearly demonstrate that the design of communities has a lot to do with the prevalence or lack of crime.

All the screenshots in this post were taken from the City of Winnipeg Crimestat website and depict reported crime for the offences reported on Crimestat for the period between January 1, 2015 and December 10, 2015.   The screen shots were taken on December 8th, 2015.


This first screen shot shows the Armstrong Point community in downtown Winnipeg which had 3 reported crimes:


2015-12-10 (1)


This screen shots show the West Broadway Community which is immediately adjacent to Armstrong Point.  West Broadway had 114 reported Crimes.

2015-12-10 (4)


This shot shows the Wildewood Park Community with 4 reported crimes:

2015-12-10 (3)

The adjacent community of Crescent Park reported 34 crimes:

2015-12-10 (5)


The  Kingston Crescent Community with 3 reported crimes:


2015-12-11


Lastly, the Elm Park community adjacent to Kingston Crescent,  24 reported crimes:


2015-12-11 (1)


I think the screen shots and the number of crimes they depict make the argument.  If you have a barrier, in this case a natural barrier such as a river surrounding a community with limited points of entry and egress and a lack of through traffic, criminals are deterred from committing crimes in those areas.  This is not a fluke.  I have been tracking these communities for years and the results are the same or very similar year after year.

Some small enclaves in newly developed residential areas such as Waverly West embody limited CPTED principles either consciously or by default.  It is unfortunate that CPTED principles are not applied  across the board in new developments.  Neighbourhoods designed and laid out based on CPTED principles would be a boon to the residents living in those neighbourhoods, as well as the Police Service in terms of a dramatic reduction in crime and the resulting calls for  service.  A crime that is prevented requires no followup or investigation.


Muggings in District 1

Between January 1st.  and October 9th. there have been 520 muggings in District 1.  That is an increase of 4% over last year.

This is what it looks like on a map.

Source:  Winnipeg Police Crimestat website

A close-up view of the immediate downtown area looks like this

Source:  Winnipeg Police Crimestat website

Can you say ‘crime cluster’?

March 2012 Crime Data

A Cautionary Tale:  March 2012 Crime Statistics for Winnipeg (for crimes tracked by Crimestat)

Crime Type Year-to-Date Comparison Selected Filter Comparison
Jan 1, 2012
To
Mar 31, 2012
Jan 1, 2011
To
Mar 31, 2011
% Change Mar 1, 2012
To
Mar 31, 2012
Mar 1, 2011
To
Mar 31, 2011
% Change
 Break & Enters – Commercial
200 151 32% 48 49 -2%
 Break & Enters – Other
200 191 5% 69 85 -19%
 Break & Enters – Residential
480 514 -7% 151 169 -11%
 Homicide
7 9 -22% 2 2 0%
 Robbery – Commercial/Financial
109 83 31% 47 33 42%
 Robbery – Non-Commercial/Financial
371 266 39% 141 85 66%
 Sexual Assault
30 45 -33% 7 18 -61%
 Shooting
18 5 260% 6 2 200%
 Theft Motor Vehicle – Actual
294 346 -15% 115 92 25%
 Theft Motor Vehicle – Attempt Only
186 289 -36% 62 91 -32%
Total 1,895 1,899 0% 648 626 4%

Source:  Winnipeg Police Crimestat website

Highlights 

1.  The city-wide crime rate (for crimes tracked by Crimestat) for the first 3 months of this year (January – March) is unchanged compared to the same period in 2011.

2.  The overall crime rate  in March of 2012 is 4% higher than in March of 2011.

3.   Commercial robberies are up 42% for March (31% year to date).

4.  Muggings are up 66% for March (39% year to date).

5.  Shootings, (although the numbers are still small 18 total so far in 2012) are increasing at an alarming rate compared to 2011 (260%).

Increase in auto theft rate:

In the February  report I drew attention to the 3% rise in auto theft rate.  In March the auto theft rate increased by 25% compared to March of 2011.    This has all the appearances of an upward trend that requires immediate attention.  If the Winnipeg Police Service allows this trend to continue unchecked it has the potential to negatively affect Winnipeg’s overall auto theft rate and undoing all of the awarding winning results achieved by the auto theft suppression strategy.

Crime Breakdown by Police District and Electoral Ward

The following 2 tables provide a breakdown of crime (tracked by Crimestat) for the first two months of 2012.  The first table shows the breakdown by police district, the second by electoral ward.  The tables are followed by Crimestat tables for the two electoral wards that showed the biggest increase in Crime.

Break down by police district

Police District February Year to date
1 +20 +15
2 -33 -25
3 +21 -1
East -7 -16
6 -6 +5
City Wide +4 -3

Breakdown by electoral ward

Electoral Ward February Year to date
Charleswood – Tuxedo +33 +30
Daniel McIntyre +34 +13
Elmwood – East Kildonan -22 -35
Fort Rouge – East Fort Garry -13 -7
Mynarski +4 -8
North Kildonan -56 -21
Old Kildonan +173 +110
Point Douglas +5 -7
River Heights – Fort Garry -15 -3
St. Boniface +22 +11
St. Charles -56 -33
St. James-Brooklands -35 -15
St. Norbert +156 +84
St. Vital +4 -14
Transcona 0 -8

Old Kildonan Electoral Ward (table)

Crime Type Year-to-Date Comparison Selected Filter Comparison
Jan 1, 2012
To
Feb 29, 2012
Jan 1, 2011
To
Feb 28, 2011
% Change Feb 1, 2012
To
Feb 29, 2012
Feb 1, 2011
To
Feb 28, 2011
% Change
 Break & Enters – Commercial
4 5 -20% 2 1 100%
 Break & Enters – Other
10 0 (NC) 8 0 (NC)
 Break & Enters – Residential
17 9 89% 7 5 40%
 Homicide
0 0 (NC) 0 0 (NC)
 Robbery – Commercial/Financial
3 1 200% 3 1 200%
 Robbery – Non-Commercial/Financial
5 0 (NC) 4 0 (NC)
 Sexual Assault
0 2 -100% 0 0 (NC)
 Shooting
0 1 -100% 0 0 (NC)
 Theft Motor Vehicle – Actual
16 7 129% 13 5 160%
 Theft Motor Vehicle – Attempt Only
8 5 60% 4 3 33%
Total 63 30 110% 41 15 173%

Source:  Winnipeg Police Crimestat website

* it appears there is an issue with the Break& Enter-Other and Robbery Non-Commercial categories.  Although the numbers vary between 2011 and 2012 the difference is shown as (N/C) indicating no change

St. Norbert Electoral Ward (table)

Crime Type Year-to-Date Comparison Selected Filter Comparison
Jan 1, 2012
To
Feb 29, 2012
Jan 1, 2011
To
Feb 28, 2011
% Change Feb 1, 2012
To
Feb 29, 2012
Feb 1, 2011
To
Feb 28, 2011
% Change
 Break & Enters – Commercial
6 0 (NC) 2 0 (NC)
 Break & Enters – Other
0 1 -100% 0 0 (NC)
 Break & Enters – Residential
16 7 129% 7 6 17%
 Homicide
0 1 -100% 0 0 (NC)
 Robbery – Commercial/Financial
3 0 (NC) 3 0 (NC)
 Robbery – Non-Commercial/Financial
10 2 400% 4 1 300%
 Sexual Assault
0 0 (NC) 0 0 (NC)
 Shooting
0 0 (NC) 0 0 (NC)
 Theft Motor Vehicle – Actual
10 12 -17% 6 2 200%
 Theft Motor Vehicle – Attempt Only
1 2 -50% 1 0 (NC)
Total 46 25 84% 23 9 156%

Source:  Winnipeg Police Crimestat website

* same issue as with the previous table in this instance in the Break&Enter Commercial and Robbery-Commercial and Theft Motor Vehicle – Attempt  categories.

Comments:

1. Although the per cent-age increased in Old Kildonan and St. Norbert are extremely high, the actual numbers when compared to other electoral wards are still very low by comparison.

2.  In Old Kildonan the increase was driven by residential break-ins and actual and attempted auto theft.

3.  In St. Norbert it was residential break-ins and muggings.

February 2012 Crime Data

February 2012 Crime Statistics for Winnipeg (for crimes tracked by Crimestat)


Crime Type Year-to-Date Comparison Selected Filter Comparison
Jan 1, 2012
To
Feb 29, 2012
Jan 1, 2011
To
Feb 28, 2011
% Change Feb 1, 2012
To
Feb 29, 2012
Feb 1, 2011
To
Feb 28, 2011
% Change
 Break & Enters – Commercial
148 102 45% 65 51 27%
 Break & Enters – Other
125 106 18% 41 45 -9%
 Break & Enters – Residential
327 345 -5% 152 190 -20%
 Homicide
5 7 -29% 3 4 -25%
 Robbery – Commercial/Financial
61 50 22% 42 12 250%
 Robbery – Non-Commercial/Financial
227 181 25% 101 84 20%
 Sexual Assault
23 27 -15% 12 9 33%
 Shooting
12 3 300% 6 1 500%
 Theft Motor Vehicle – Actual
187 254 -26% 113 110 3%
 Theft Motor Vehicle – Attempt Only
122 198 -38% 76 84 -10%
Total 1,237 1,273 -3% 611 590 4%

Source:  Winnipeg Police Crimestat website

Highlights

1.  City wide crime (for crimes tracked by Crimestat) for the first 2 months of the year is down 3%.

2.  The month of February however saw a 4% increase in crime.

3.  Auto theft was up 3% in February.

4.  Residential break-ins are down but commercial break-in are rising.

5.  Robberies are on the increase (commercial robberies up 250% in February).

6.  Dramatic percentage increase in the number of shootings although the actual numbers are still small.

Caution:  The rise (though modest) in the number of auto thefts is a concern.  After years of declines this is the first reversal I recall.  Steps should be taken to address this.

January 2012 Crime Data

January 2012 Crime Statistics for Winnipeg  (for crimes tracked by Crimestat)

Crime Type Year-to-Date Comparison Selected Filter Comparison
Jan 1, 2012
To
Feb 4, 2012
Jan 1, 2011
To
Feb 4, 2011
% Change Jan 1, 2012
To
Jan 31, 2012
Jan 1, 2011
To
Jan 31, 2011
% Change
 Break & Enters – Commercial
85 63 35% 79 51 55%
 Break & Enters – Other
83 62 34% 81 61 33%
 Break & Enters – Residential
186 188 -1% 167 155 8%
 Homicide
1 3 -67% 1 3 -67%
 Robbery – Commercial/Financial
22 39 -44% 19 38 -50%
 Robbery – Non-Commercial/Financial
131 110 19% 122 97 26%
 Sexual Assault
11 18 -39% 10 18 -44%
 Shooting
6 2 200% 6 2 200%
 Theft Motor Vehicle – Actual
85 161 -47% 72 144 -50%
 Theft Motor Vehicle – Attempt Only
49 129 -62% 46 114 -60%
Total 659 775 -15% 603 683 -12%

Source:  Winnipeg Police Crimestat Website

Highlights

1.  City wide crime (for crimes tracked by Crimest) is down 12%.  Districts 2, 3 and the East District  show reductions, Districts 1 and 6 show increases.

2.  The Auto Theft Strategy (perhaps the only true evidence based initiative the WPS is using) continues to show impressive results in terms of crime reduction.

3.  When the auto theft category (actual and attempt)  is removed,  crime (for crimes tracked by Crimestat) is up 14% city-wide.

2.  Muggings are up 26%.

3.  Commercial robberies are down 50%.

4.  All three categories of break-ins are up between 8 and 55%.

The Case of the Moving Icons

A few weeks ago I looked at  the Crimestat map for the North Point Douglas community, specifically the icons representing homicides.

The next day I looked at them again and although going strictly from memory, it appeared they had moved.

That caused me to “save” a few images over a period of days just to track whether or not the position of the icons was indeed altered from one day to the next.  It turned out that the problem was Crimestat’s and not mine.

The following maps, saved on different dates, are for the North Point Douglas community.  They clearly show that the cluster of 6 homicides are not stationary.  As you will note, the icons change location from day-to-day.

Map. 1  (November 28 2011)

Map 2  (December 1st. 2011)

Map 3  (December 3rd. 2011)

This caused me to click on the Contact Us button on the Crimestat Website.  I sent them the following message on November 27th:  “I notice that the icons for the cluster of homicides in North Point Douglas change positions from day-to-day.  Why would that be?”   Having received no reply I sent a reminder on December 1st,  still no reply.

I’m assuming the City does not know the answer or surely they would have responded by now or perhaps it is of no consequence to them.  The fact is, though, the icons, like the victims they represent, should not be moving to the degree they are (i.e. almost into another community) because, otherwise, the map is not an accurate representation.

Is there anyone out there who has expertise with geospatial analysis software that could explain what is happening here?  Perhaps we can send a few hints on to the City to assist them in rectifying this problem.